
St. Vincent and the Grenadines Tourism Authority Welcomes Mrs. Shafia T. London as Chief Executive Officer.
The Board of Directors and Staff of the St. Vincent and the
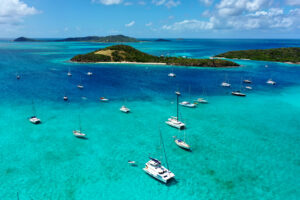
St. Vincent and The Grenadines Recognized in Wanderlust’s Travel Magazine.
Where sea turtles glide over coral gardens and turquoise waters stretch to
Festival
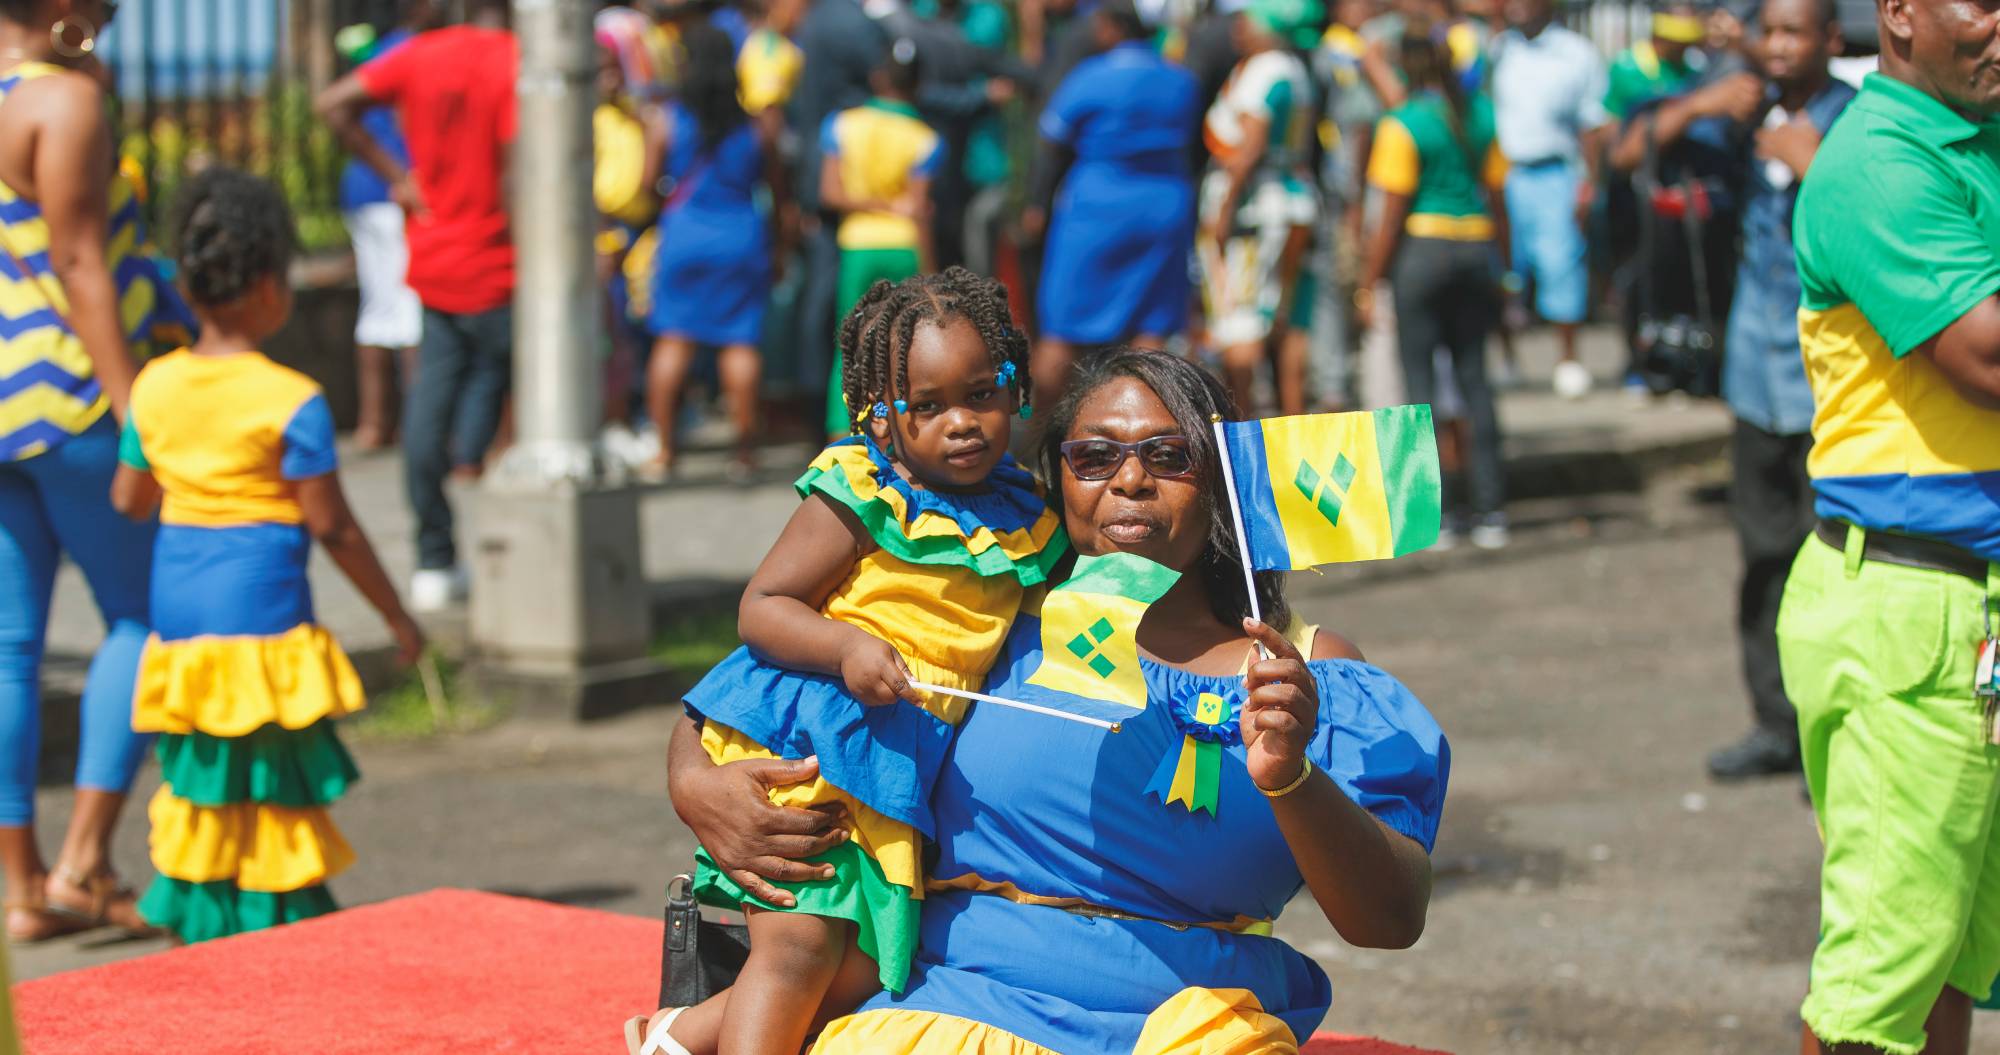
Independence Celebration
St. Vincent and the Grenadines (SVG) celebrates the nation’s anniversary of independence with a variety of events including motorsports.
Festival
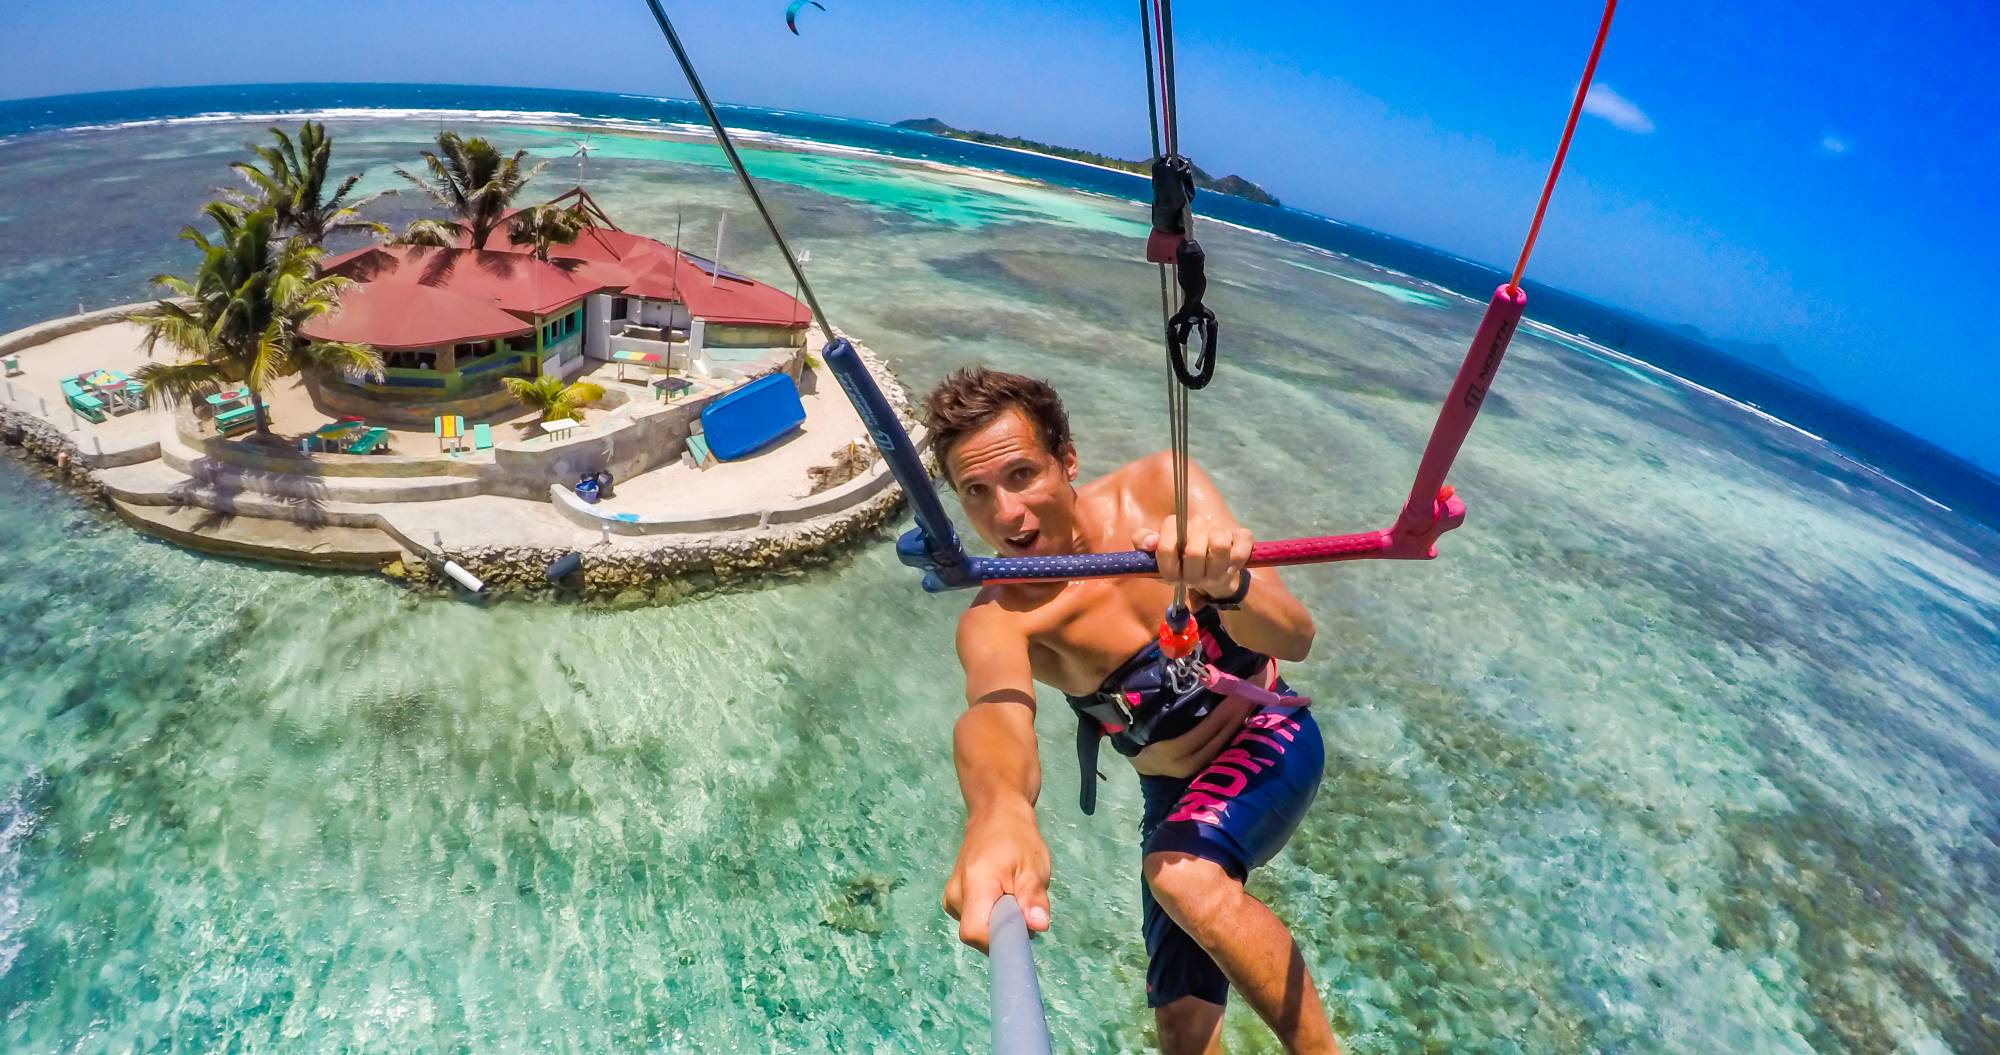
JT Pro Center Light, Kite Surfing Show & Full Moon Beach Party
This event allows patrons to enjoy the full moon rise in all its splendid glory. The event starts around 6:30pm, facing the moon rise.
Festival
Keegan’s Beachside Seafood Fest
Keegan’s Seafood Fest is an annual celebration of freshly caught and prepared seafood.
Festival
Mayreau Regatta
Mayreau’s small population of less than 300 persons are a close knitted community whose traditions are reflected in their regatta activities.